
KUKA: Quarterly release for 3rd quarter 2018
source:KUKA
release:Johnny
Time:2018-11-23
Orders received down 6.8 percent to €750.1 million in Q3
Order backlog remains unchanged at a high level of €2,197.5 million as at September 30, 2018 (September 30, 2017: €2,210.7 million)
Sales revenues up 6.6 percent to €851.0 million (Q3/18)
EBIT margin reaches 4.2 percent (Q3/18) before purchase price allocations, growth investments and reorganization expenditure
Guidance adjustment for 2018: sales revenue of around €3.3 billion and EBIT margin at around 4.5 percent.
In the third quarter of 2018, KUKA Group increased sales revenues by 6.6 percent compared with the previous year. While orders received were down slightly to €750.1 million (-6.8 percent), the order backlog remains high at €2,197.5 million (September 30, 2018). The EBIT margin before purchase price allocations, growth investments and reorganization expenditure decreased from 5.5 percent (Q3/17) to 4.2 percent (Q3/18). based on the current economic environment and business development, KUKA has slightly adjusted its outlook for the 2018 fiscal year. Expected sales revenue is around €3.3 billion and thus below the forecast of more than €3.5 billion issued at the start of the year. The forecast EBIT margin at about 4.5 percent.
“After a long period of growth, we react on the worsened economic environment and are placing a stronger focus on our efficiency program. Our strategic course with orientation towards focus markets and investments in key technologies for Industrie 4.0 remains the basis for our long-term success,” says Dr. Till Reuter, CEO of KUKA AG. “The establishment of the joint ventures with Midea in China is going according to plan, with the result that we will be able to generate further growth there.”
In the third quarter of 2018, KUKA Group generated orders received totaling €750.1 million. Compared with the same quarter in the previous year (€804.4 million), this corresponds to a slight reduction of 6.8 percent.
In the first nine months of 2018, orders received totaled €2,610.5 million – a minus of 6.1 percent compared with the value for the previous year. Although the decline reflects current developments in the global economy, it was nonetheless possible to generate a high overall level of orders received, particularly in Europe.
The Automotive segment recorded orders received amounting to €384.3 million in the third quarter of 2018, giving a total volume of €1,276.5 million in the first nine months of 2018. Here, once again, orders received were predominantly registered in Europe.
Orders received in the Industries segment amounted to €216.4 million in the third quarter of 2018. In the first nine months of 2018, the total figure was €751.1 million. This represented a continuation of the positive development in the first half-year. Good results for this segment were achieved primarily in Europe and Asia.
In the third quarter of 2018, the Consumer Goods & Logistics Automation segment generated orders received amounting to €94.7 million, mainly in the Europe and Americas regions. The volume of orders received here totaled €428.7 million in the first nine months of 2018.
In the third quarter of 2018, sales revenues of KUKA Group totaled €851.0 million. This corresponds to a 6.6 percent increase on the previous year’s result for the same quarter (Q3/17: €798.6 million). In a nine-monthly comparison, this value decreased by 5.7 percent and amounted to €2,448.3 million (9M/17: €2,597.1 million).
In the Automotive segment, KUKA Group achieved sales revenues of €404.9 million in the third quarter. The figure for the first nine months was €1,190.9 million.
Sales revenues in the Industries segment were €236.0 million in the third quarter and totaled €674.6 million in the first nine months of 2018.
Consumer Goods & Logistics Automation reported sales revenues of €148.0 million in the quarter under review. In the first nine months, the segment achieved an overall volume of €450.7 million, thus reflecting the positive development from the previous quarter.
The book-to-bill ratio – in other words the ratio of orders received to sales revenues – came in at 0.88 in the past quarter (Q3/17: 1.01). In the first nine months, this indicator amounted to 1.07 (9M/17: 1.07). In a nine-monthly comparison, this value remains unchanged at above 1, thus indicating good capacity utilization and growth.
As at September 30, 2018, the order backlog for the Group amounted to €2,197.5 million, and was thus at virtually the same level as the previous year (September 30, 2017: €2,210.7 million).
In the quarter under review, earnings before interest and taxes (EBIT) totaled €26.4 million (margin: 3.1 percent) – a 6.7 percent decline on the previous year’s result for the same quarter (Q3/17: €28.3 million; margin 3.5 percent). This decline is primarily attributable to the increased costs for sales, administration, research and development. Disregarding the purchase price allocations for corporate acquisitions, growth investments and reorganiza-tion expenditure, the EBIT is €35.6 million with an EBIT margin of 4.2 percent.
In the first nine months of 2018, EBIT decreased by 15.2 percent to €93.9 million (9M/17: €110.7 million). The margin correspondingly amounted to 3.8 percent (9M/17: 4.3 per-cent). Disregarding the purchase price allocations for corporate acquisitions, growth investments and reorganization expenditure, the EBIT in the first nine months of 2018 is €121.6 million with an EBIT margin of 5.0 percent.
The EBIT for Automotive totaled €21.1 million in the third quarter of 2018 with a margin of 5.2 percent. In the first nine months, EBIT reached a value of €75.9 million. The corresponding margin was 6.4 percent.
EBIT at Industries in the third quarter of 2018 totaled €8.4 million, with a margin of 3.6 percent. In the first nine months, the EBIT was €64.3 million with a margin of 9.5 percent.
At Consumer Goods & Logistics Automation, the EBIT amounted to €1.1 million with a corresponding margin of -0.7 percent. The figure for the first nine months was -€1.2 million with a margin of -0.3 percent. Disregarding the purchase price allocation, the EBIT would be €3.1 million in the first nine months, with an EBIT margin of 0.7 percent.
The number of employees in KUKA Group declined by 2.0 percent from 13,988 (September 30, 2017) to 13,710 as at September 30, 2018.
Given the current economic forecasts and general conditions and taking into consideration the existing risk and opportunity potential, KUKA anticipates stable demand from Europe in the 2018 fiscal year. KUKA expects weaker growth in Asia than forecast at the start of the year. This is due primarily to a slowdown in the Asian market for jointed-arm robots compared with the previous year. In North America, and particularly in the Automotive sector, KUKA is expecting a slight decline due to the completion of various model updates. A positive development is anticipated in the area of General Industry. Uncertainties exist primarily on account of the current developments in the global economy and in particular the trade dispute between the USA and China. This also affects the world’s largest robotics markets, such as the automotive and electronics industries, where we shall continue to keep a close eye on developments.
For these reasons, and based on the current economic environment and business development, KUKA expects to generate sales revenues of around €3.3 billion in the 2018 fiscal year; this is below the forecast of more than €3.5 billion that was made at the start of the year. KUKA predicts an EBIT margin of about 4.5 percent before purchase price allocations amounting to around €15 million, before growth investments and before reorganization expenditure of about €30 million. The investments relate, for example, to Group-wide issues such as digitization, Industrie 4.0, mobility, general industry and China. KUKA is expecting these investments to open up additional areas of growth for the Group in the coming years, which should be reflected in higher sales revenues. KUKA will report on its mid-term planning at the 2019 Annual Press Conference.
Here you can download the complete quarterly release.
Orders received
2,779.2
2,610.5
-6.1
Order backlog (September 30)
2,210.7
2,197.5
-0.6
Sales revenues
2,597.1
2,448.3
-5.7
Gross earnings from sales
593.2
579.2
-2.4
in % of sales revenues
22.8
23.7
–
EBIT (earnings before interest and taxes)
110.7
93.9
-15.2
in % of sales revenues
4.3
3.8
Non-operating adjustments?*
28.7
27.7
-3.5
Adjusted EBIT
139.4
121.6
-12.8
Adjusted EBIT in % of sales revenues
5.4
5.0
EBITDA (earnings before interest, taxes, depreciation and amortization)
166.2
157.8
-5.1
in % of sales revenues
6.4
6.4
–
Non-operating adjustments?*
21.4
18.0
-15.9
Adjusted EBITDA
187.6
175.8
-6.3
Adjusted EBITDA in % of sales revenues
7.2
7.2
–
Earnings after taxes
79.4
73.4
-7.6
Earnings per share (diluted/undiluted) in €
2.0
1.78
-11.0
Capital expenditure
64.7
195.2
>100
Equity ratio in % (September 30)
32.9
42.3
–
Net liquidity?/debt (September 30)
-45.4
93.7
>100
Employees (September 30)
13,988
13,710
-2.0
*Non-operating adjustments relate to growth investments, restructuring costs and effects from the purchase price allocation for acquisitions.
Orders received
804.4
750.1
-6.8
Order backlog (September 30)
2,210.7
2,197.5
-0.6
Sales revenues
798.6
851.0
6.6
Gross earnings from sales
188.6
193.8
2.8
in % of sales revenues
23.6
22.8
–
EBIT (earnings before interest and taxes)
28.3
26.4
-6.7
in % of sales revenues
3.5
3.1
Non-operating adjustments?*
15.6
9.2
-41.0
Adjusted EBIT
43.9
35.6
-18.9
Adjusted EBIT in % of sales revenues
5.5
4.2
EBITDA (earnings before interest, taxes, depreciation and amortization)
47.1
48.4
2.8
in % of sales revenues
5.9
5.7
–
Non-operating adjustments?*
14.4
6.0
-58.3
Adjusted EBITDA
61.5
54.4
-11.5
Adjusted EBITDA in % of sales revenues
7.7
6.4
–
Earnings after taxes
19.2
23.0
19.8
Earnings per share (diluted/undiluted) in €
0.48
0.52
8.3
Capital expenditure
23.8
67.5
>100
*Non-operating adjustments relate to growth investments, restructuring costs and effects from the purchase price allocation for acquisitions.
Orders received generated primarily in Europe
Employees worldwide
Guidance for 2018 adjusted
Key figures
in € millions
9M/17
9M/18
Change in %
–
–
in € millions
Q3 /17
Q3/18
Change in %
–
–
 FISBA exhibits Customized Solutions for Minimally Invasive Medical Endoscopic Devices at COMPAMED in
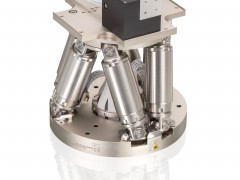 New Active Alignment System for the Coupling of Photonic Structures to Fiber Arrays
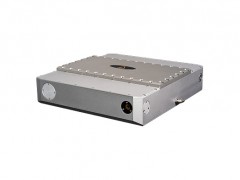 A new industrial compression module by Amplitude
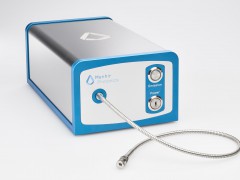 Menhir Photonics Introduces the MENHIR-1550 The Industry's First Turnkey Femtosecond Laser of
 Shenzhen DNE Laser introduced new generation D-FAST cutting machine (12000 W)